OVERFITTING
In this blog I will explain the concept of Overfitting using polynomial Regression, how to detect it and different ways to prevent it.
Overview of Overfitting:
When a model fits more data than it needs, it starts catching noisy data and inaccurate values in the data. As a result, the efficiency and the accuracy of the model decrease.
When we run the training algorithm on the data set, we allow the cost to reduce with each number of iteration so running this algorithm for too long will result in reduced cost but it will also fit the noisy data from the data set.
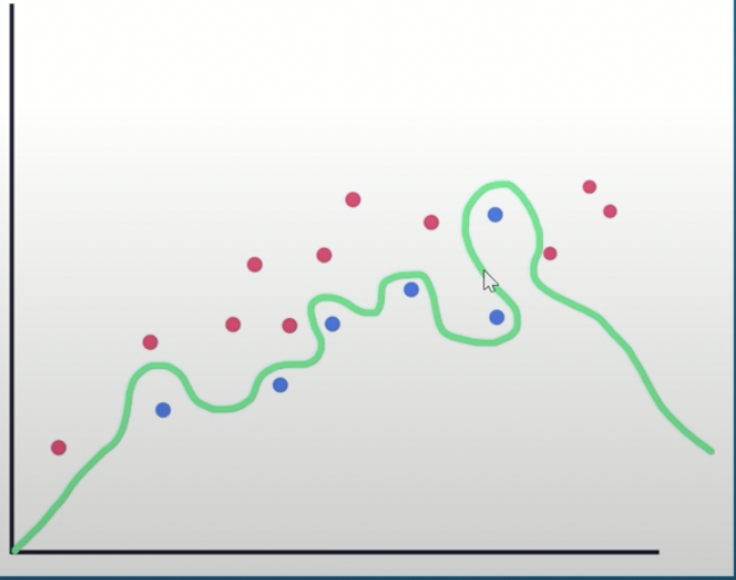
The result will look like the graph below
It looks efficient but it’s not the main goal of the algorithm such as linear regression is to find a dominant trend and fit the data points accordingly but in this case, the line fits all the data points which is irrelevant to the efficiency of the model in predicting optimum outcomes for the new entry data points.
When we run the training algorithm on the data set, we allow the cost to reduce with each number of iteration so running this algorithm for too long will result in reduced cost but it will also fit the noisy data from the data set.
Underfitting
To avoid overfitting, we could stop the training at an initial stage. But it might also lead to the model not being able to learn enough from training data, which may find it difficult to capture the dominant trend. This is known as UNDERFITTING.
Underfitting is when you have a high bias with the new data
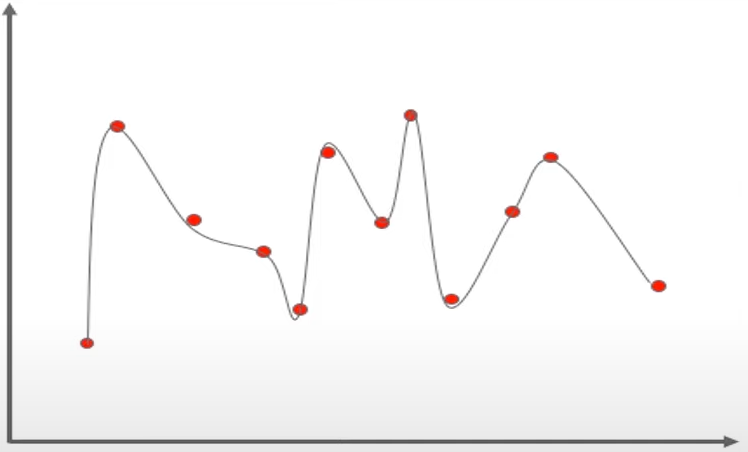
The graph below displays underfitting
The result is the same as overfitting like it will cause inefficiency in predicting the outcomes, but it will take fewer data to recognize the dominant trend inside the data set.
HOW TO DETECT OVERFITTING?
During the training, we will have the training error and the validation error, i.e, the error on the training set and error on the validation set, we have to observe how these errors are developing
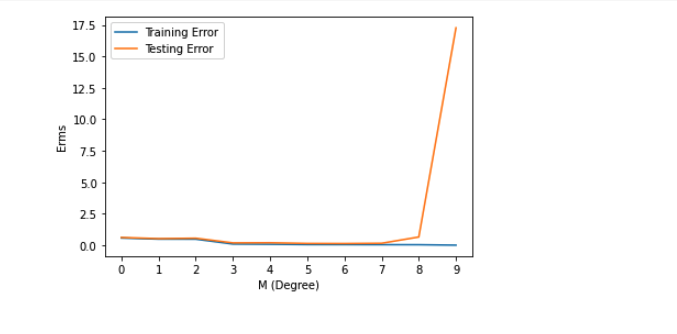
For example, The graph below contains a Blue line for the training error and a red line for the Validation error
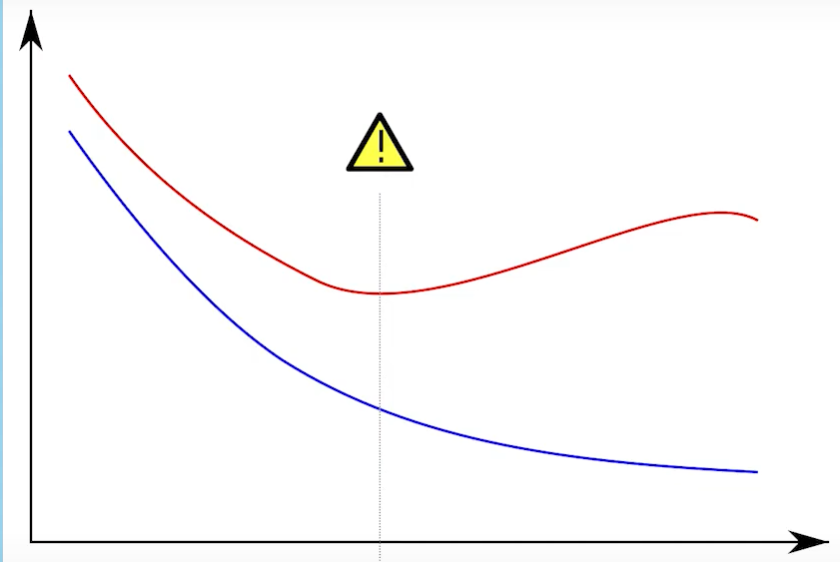
Initially, both are decreasing gradually which means both are getting lower and lower error rates, but after a while, the Validation error is going up while the training error is continuing to show the downward trend.
The model here is learning what the taring set looks like and it’s adapting itself to the training set all the time hence the reason the training error is showing the continuous downward trend whereas the validation error is increasing because it’s not caring about the validations had as much right it’s only caring about adapting itself to our training set here.
If you have a similar graph with training and validation errors then you’re probably suffering from overfitting
The main challenge with overfitting is to estimate the accuracy of the performance of our model with new data as we would not be able to estimate the accuracy until we test it.
HOW TO AVOID OVERFITTING?
- Cross-Validation
- Training with more data
- Regularization
- Removing Features
- Ensembling
- Early Stopping
Lets' start the implementation
Overfitting with Higher order Linear Regression
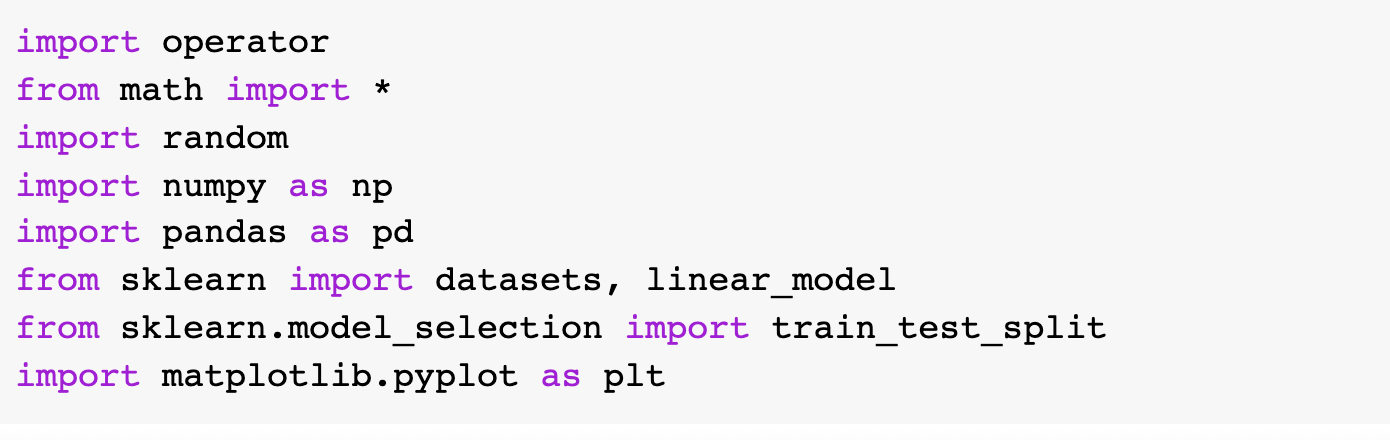
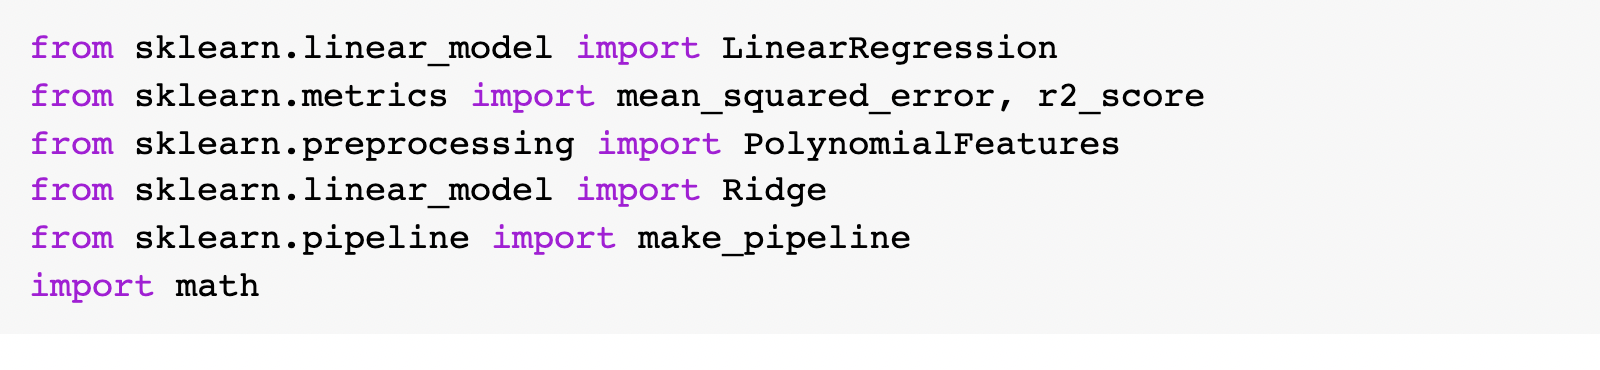
Import the Libraries
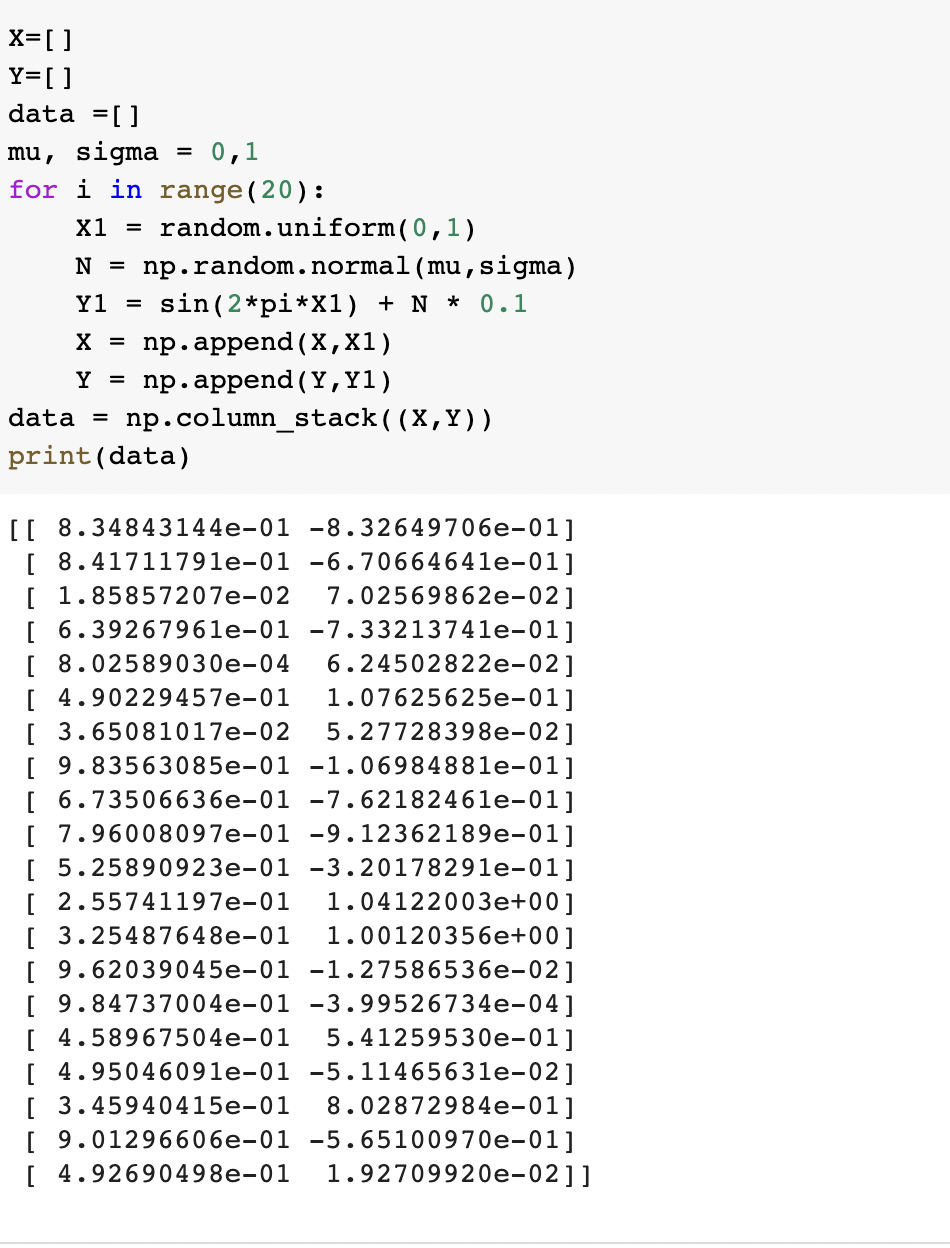
Generate 20 random values
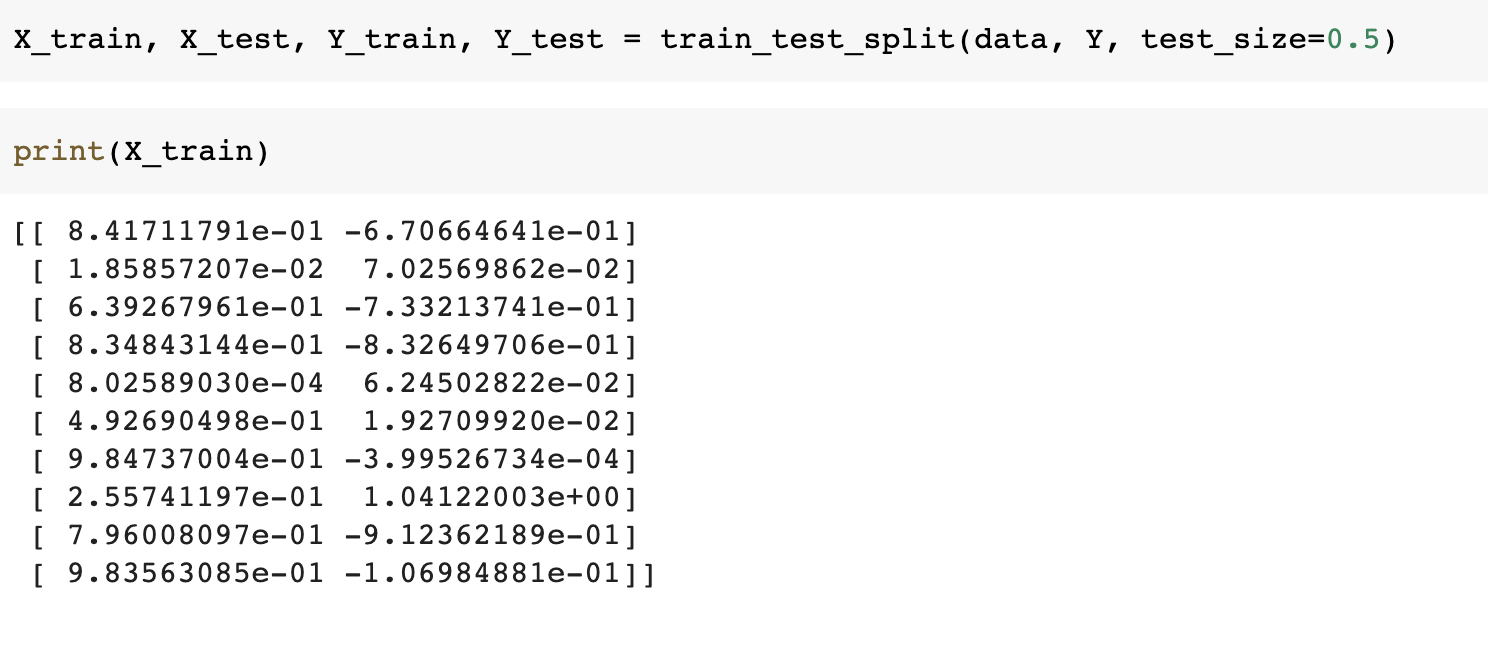
Splitting the data into two equal parts: train and test both having 10 pairs
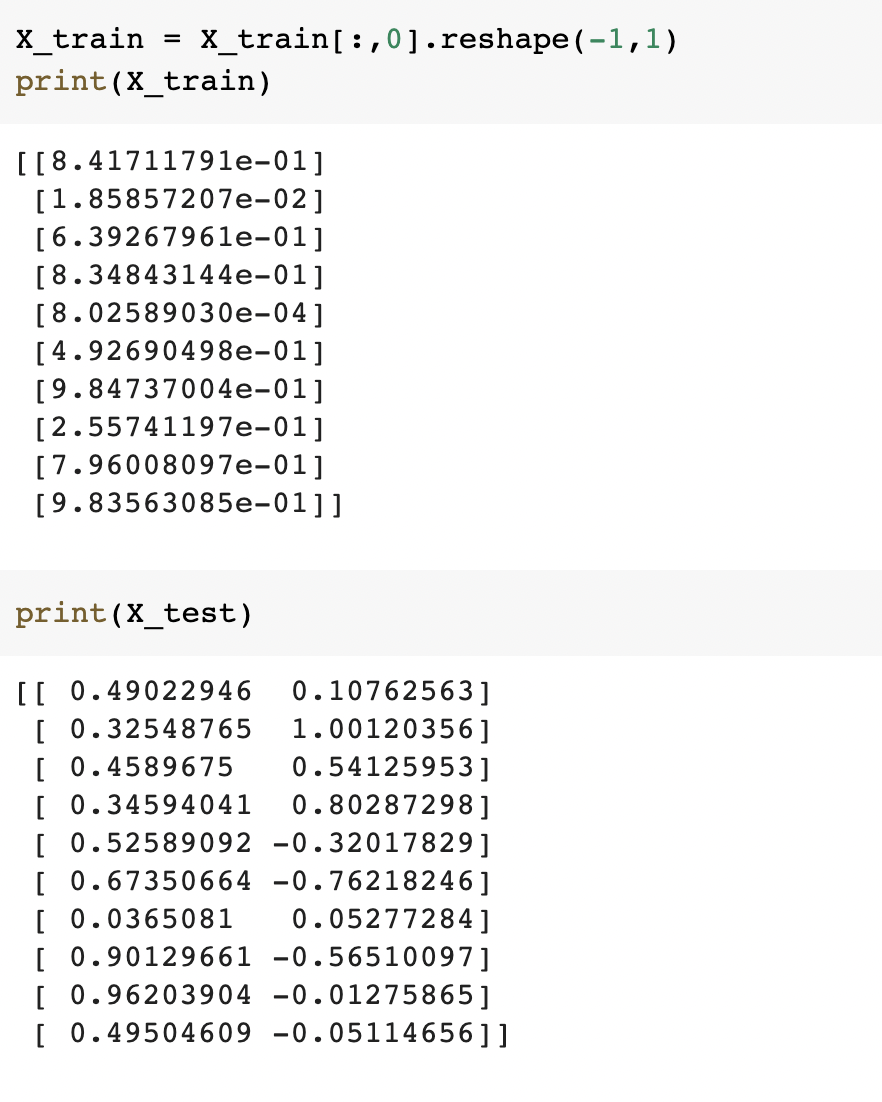
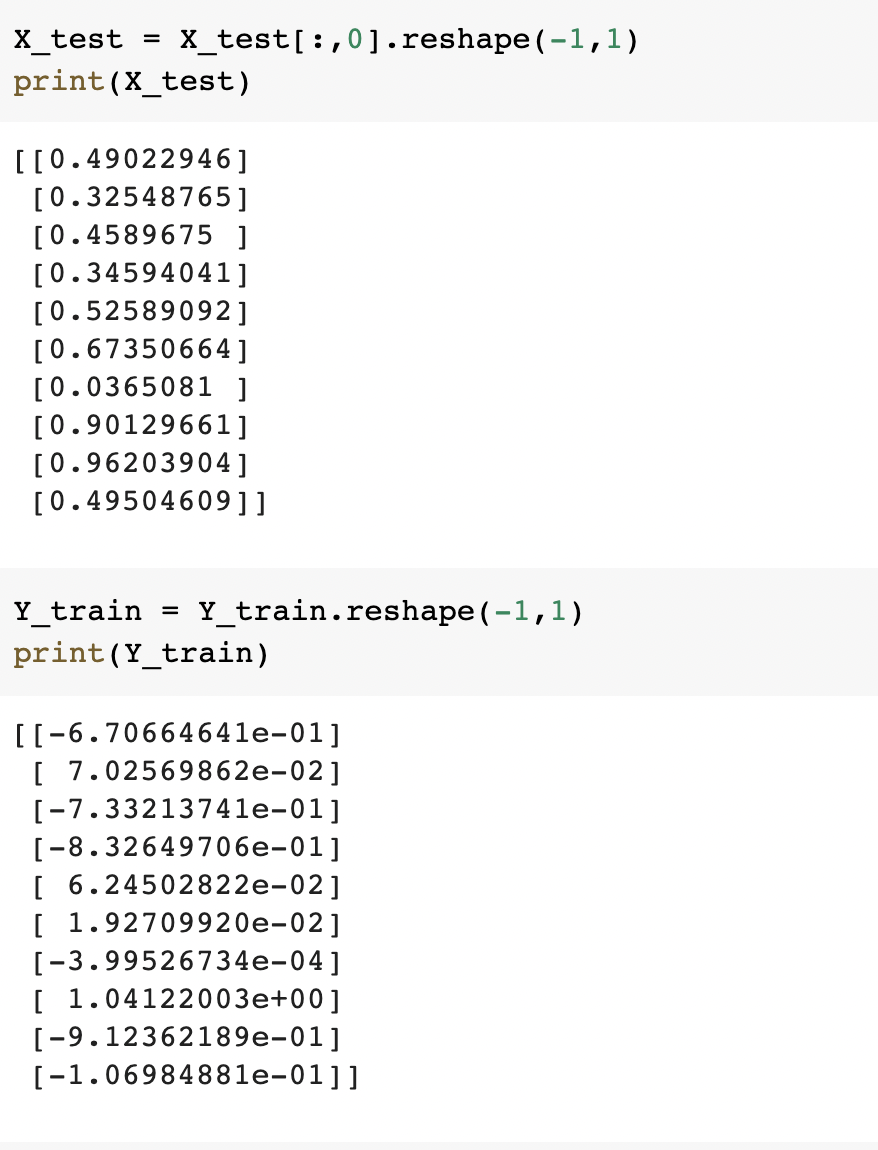
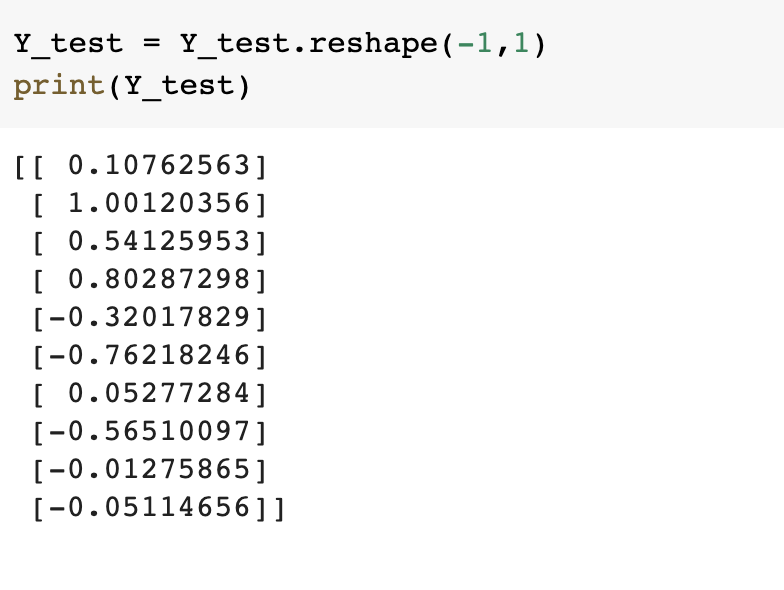
Reshape the data(Reshaping is used to make an array column-wise)
Importing more dependencies
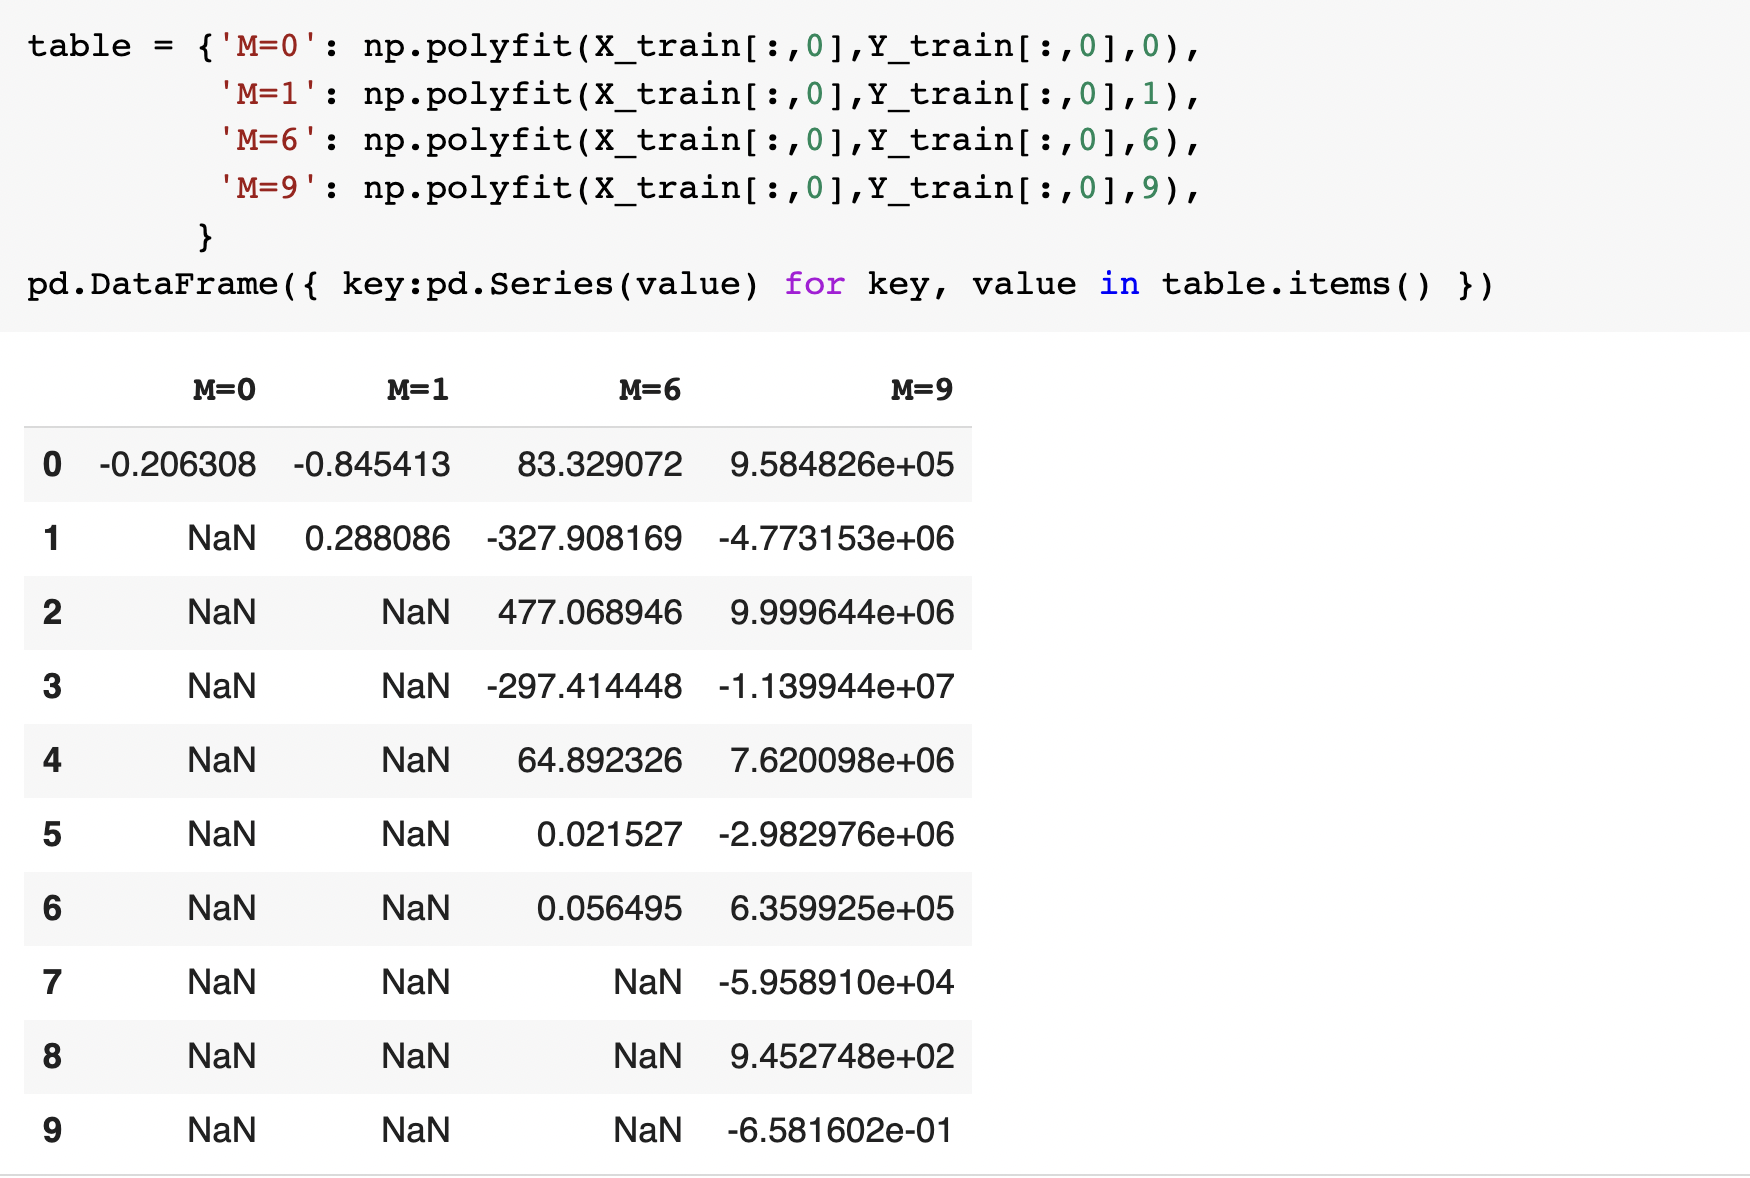
Using root mean square error, find weights of polynomial regression for order is 0, 1, 3, 9
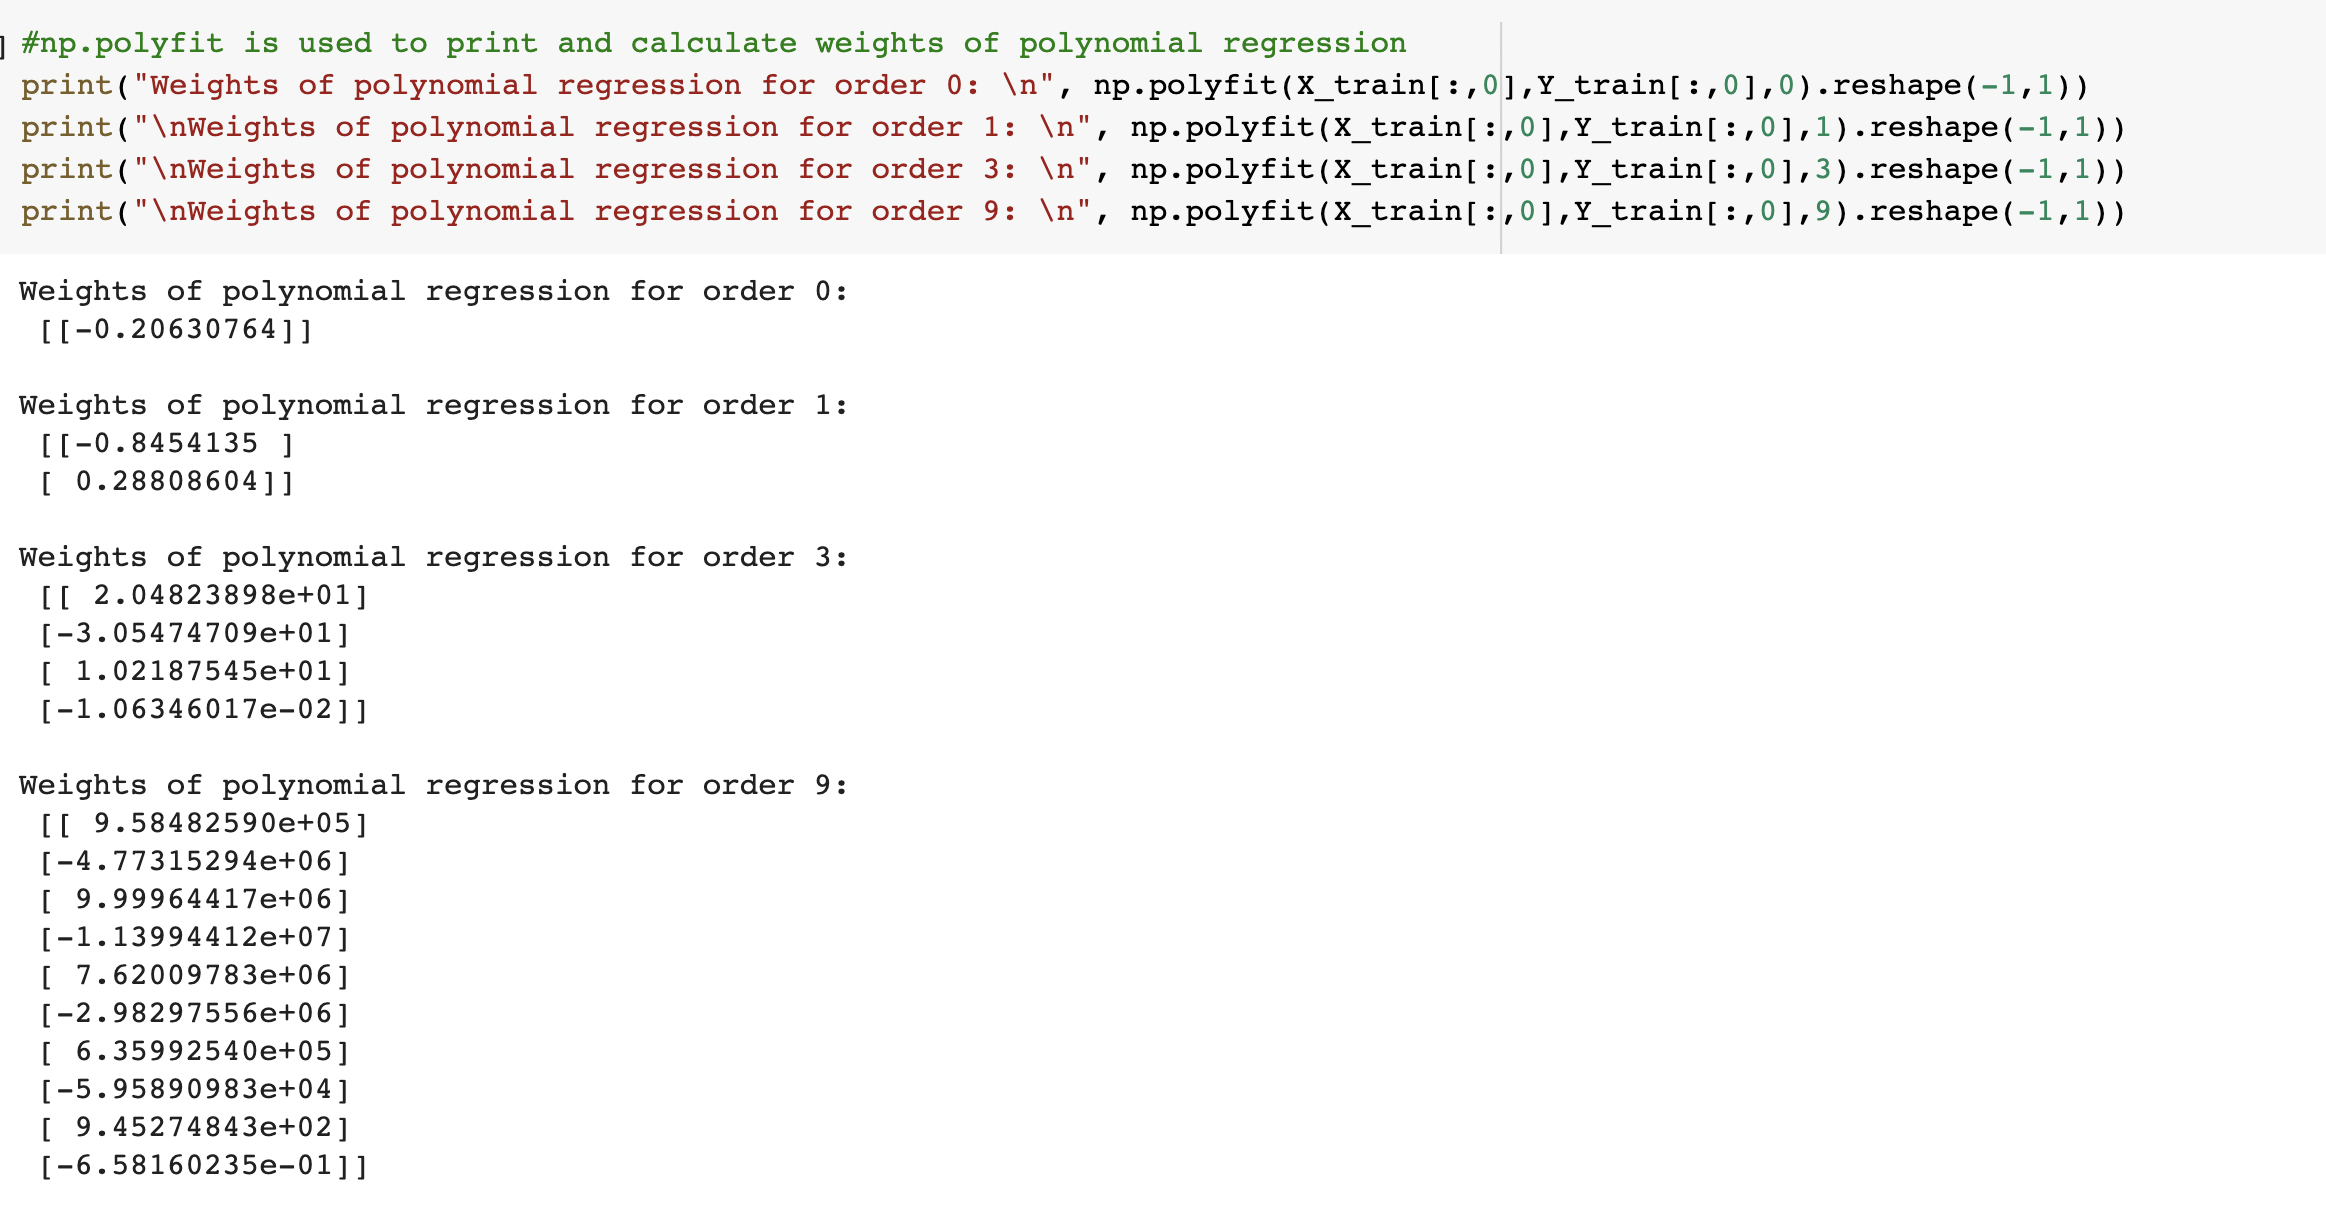
Displaying weights in table
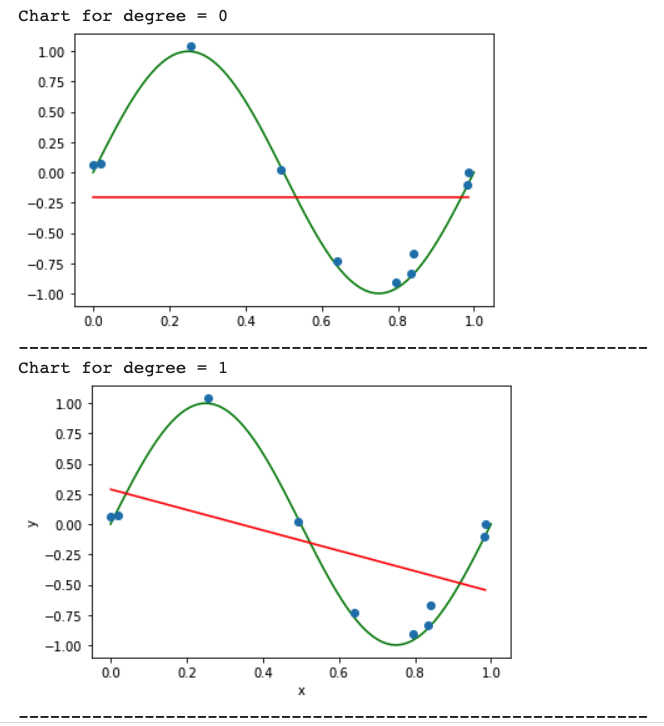
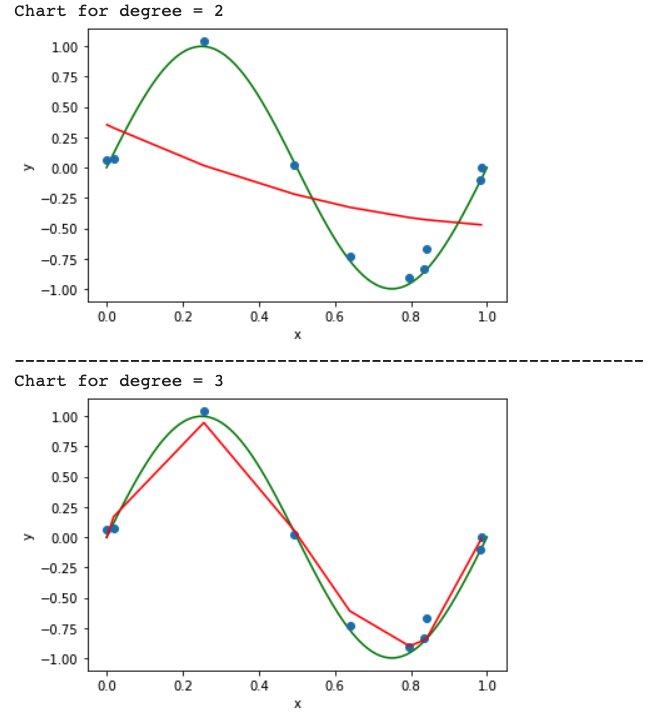
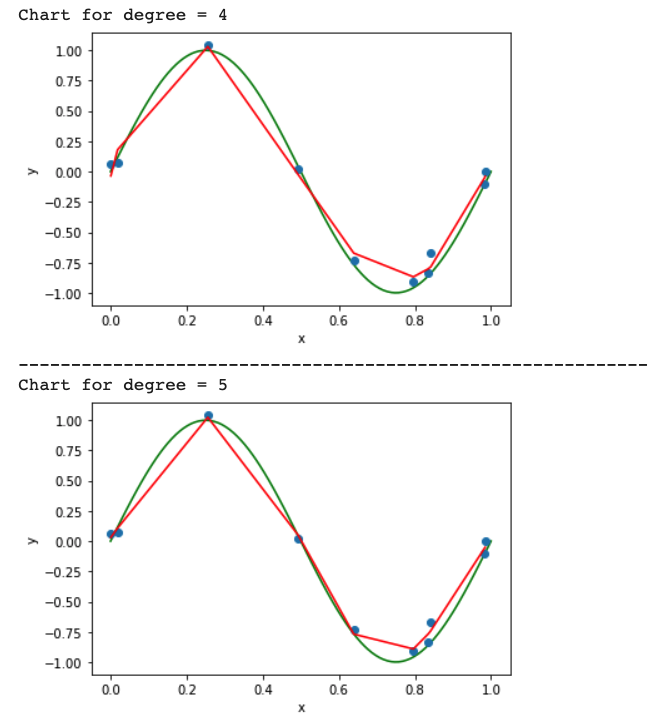
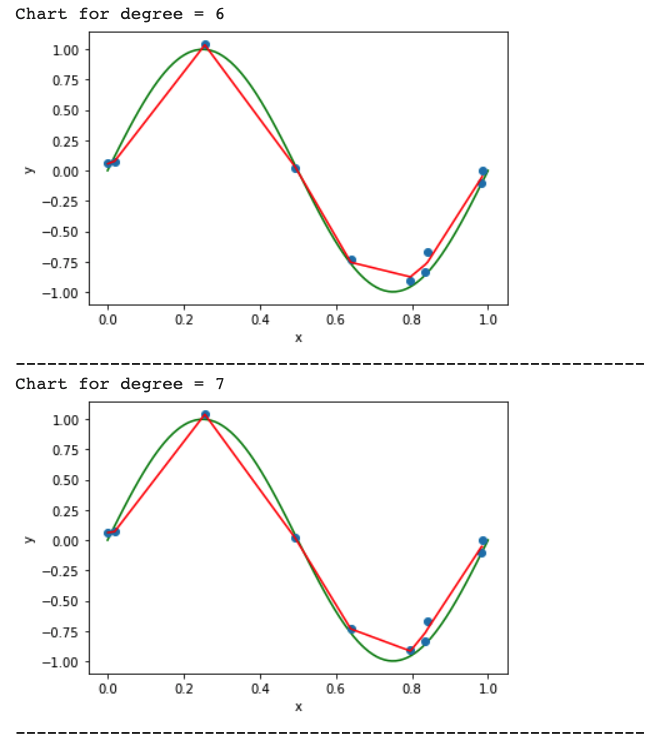
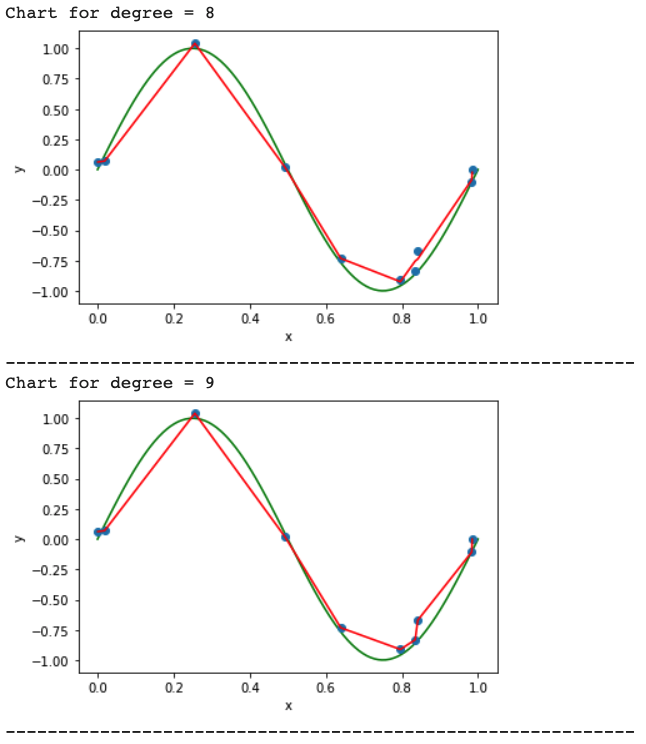
Draw a chart of fit data
sorted X and Y data simultaneously to get proper line graph ouput
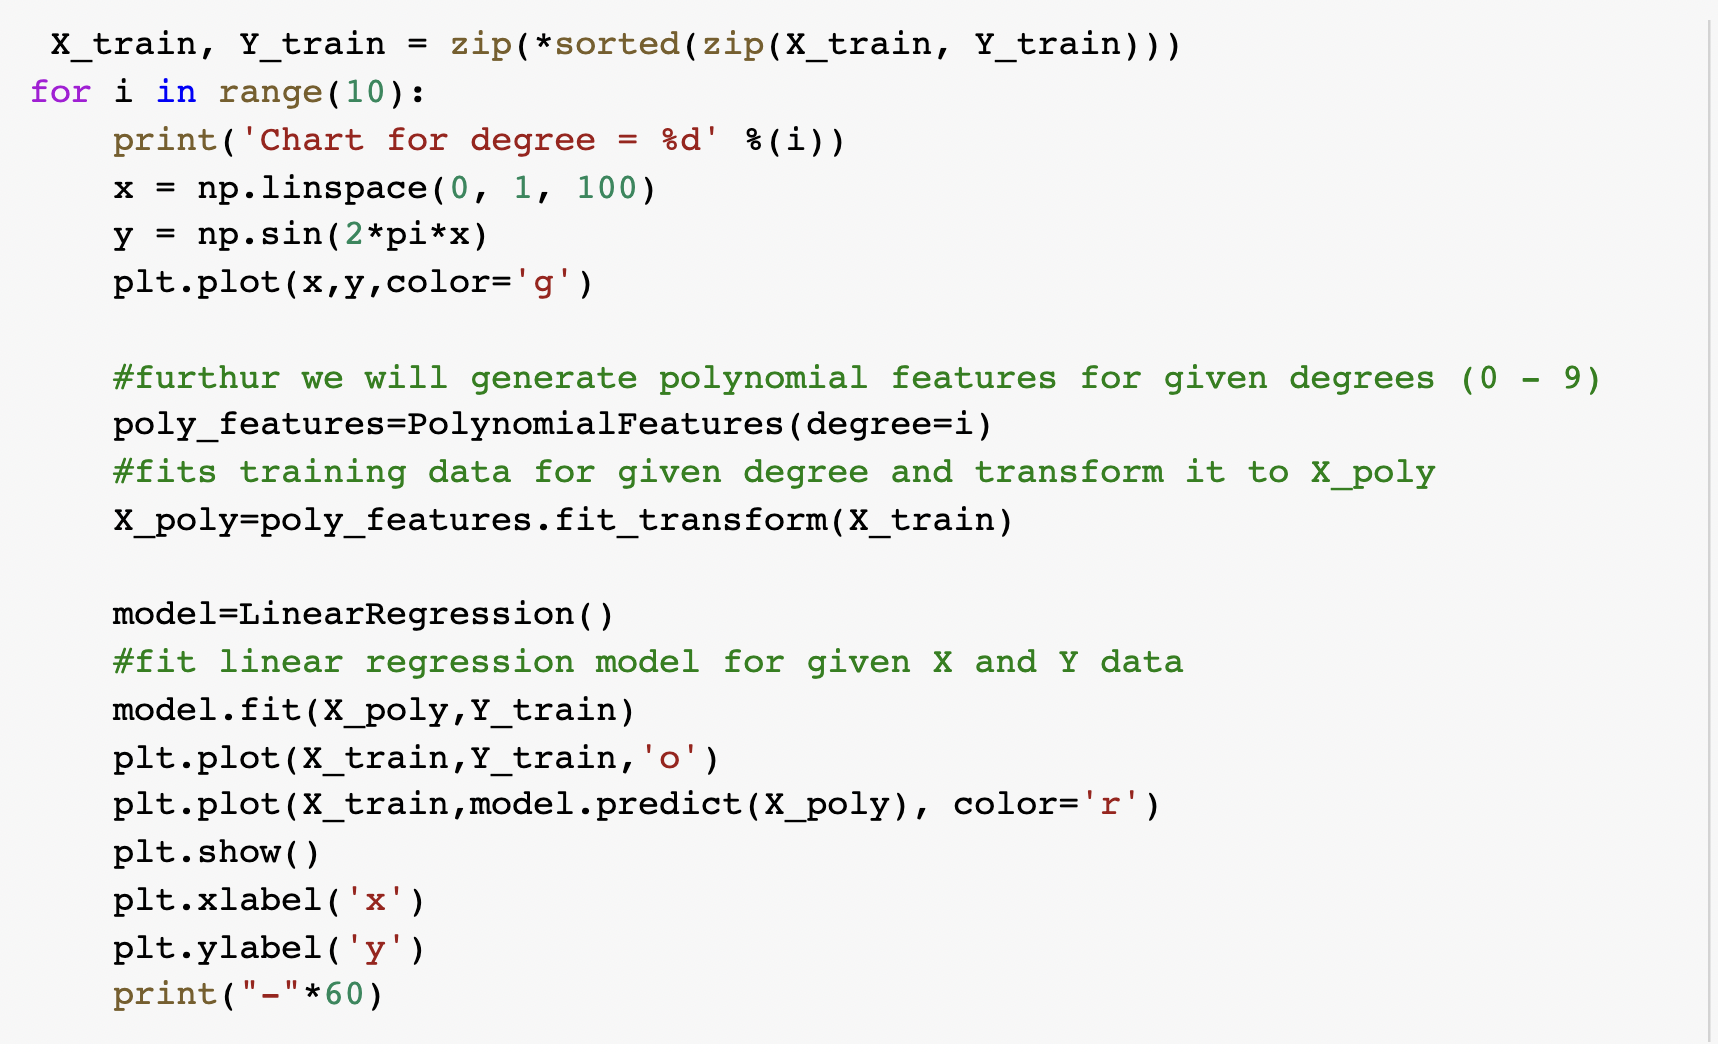
The graph will look like below:
Calculate the Train error v/s Test error
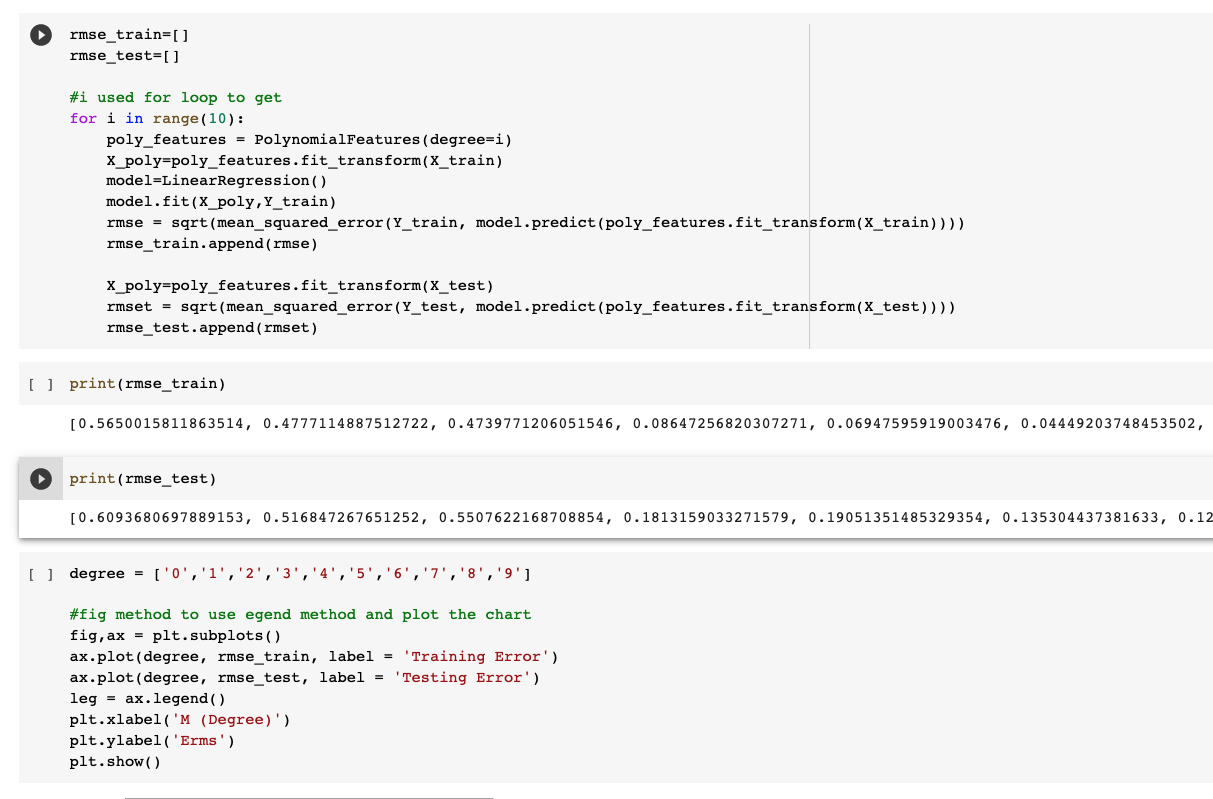
Calculating the training and Testing error, we get:
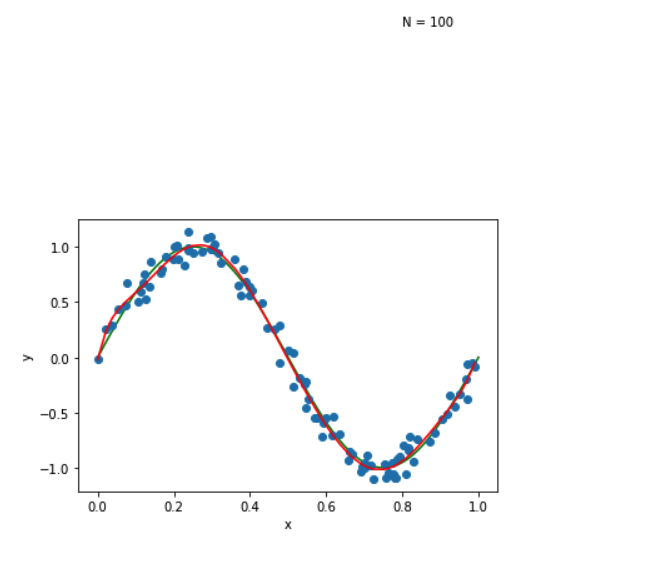
Now generate 100 more data and fit 9th order model and draw fit
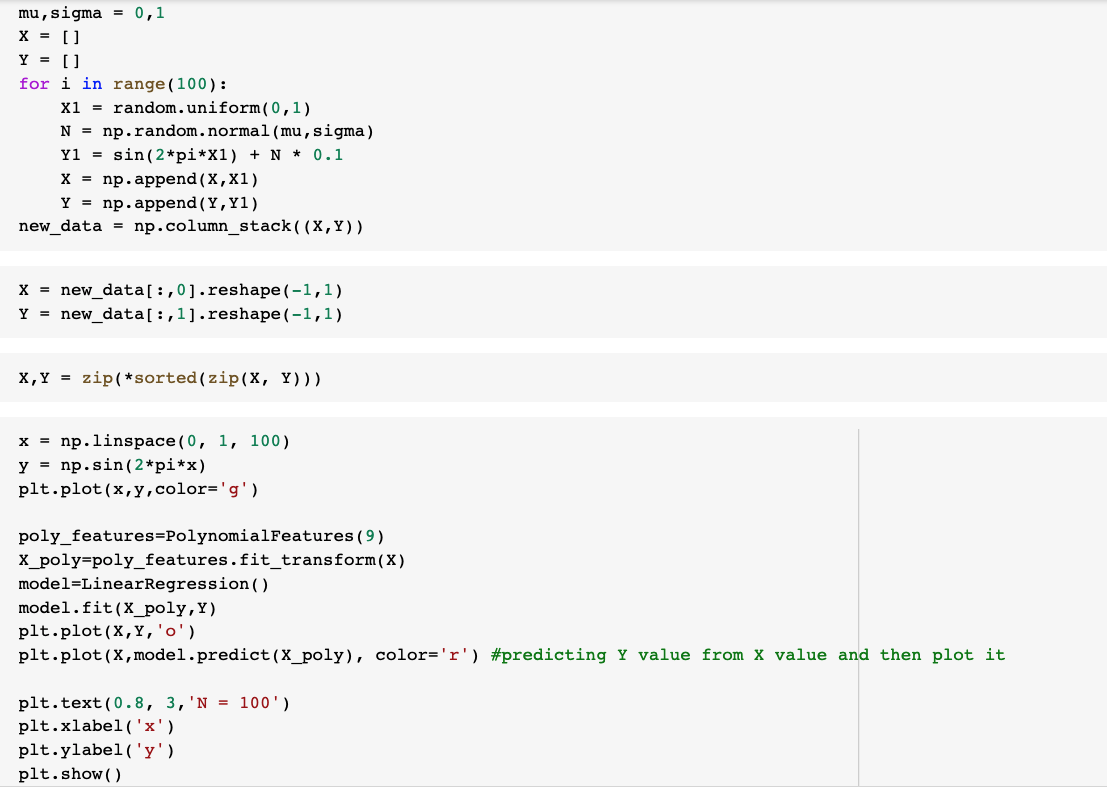
Generating the 9th order using the same previous method:
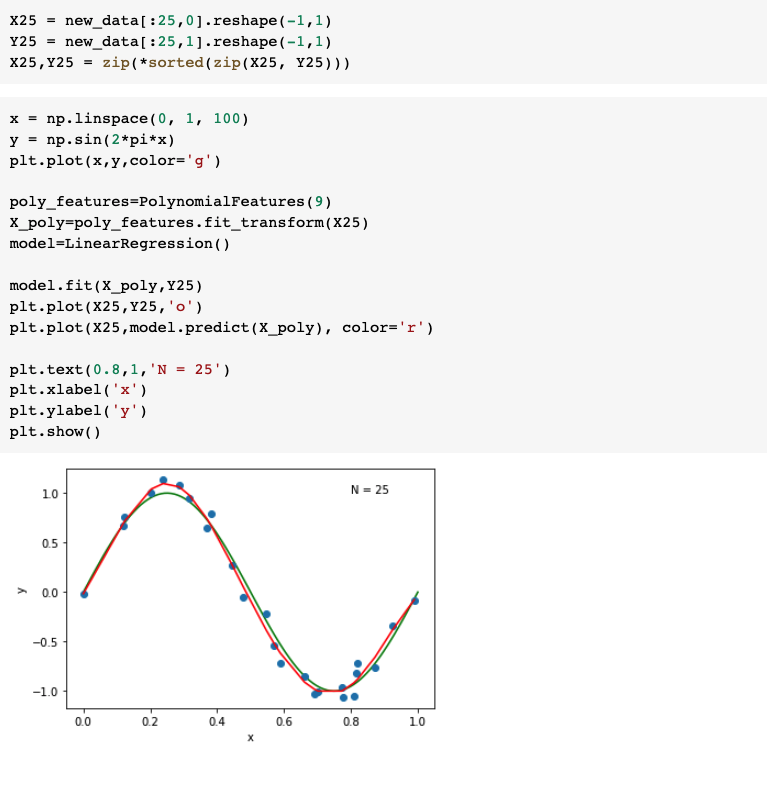
Selected 25 data and fit 9th order model and draw fit
Now we will regularize using the sum of weights
Using Regularization method, we can prevent overfitting
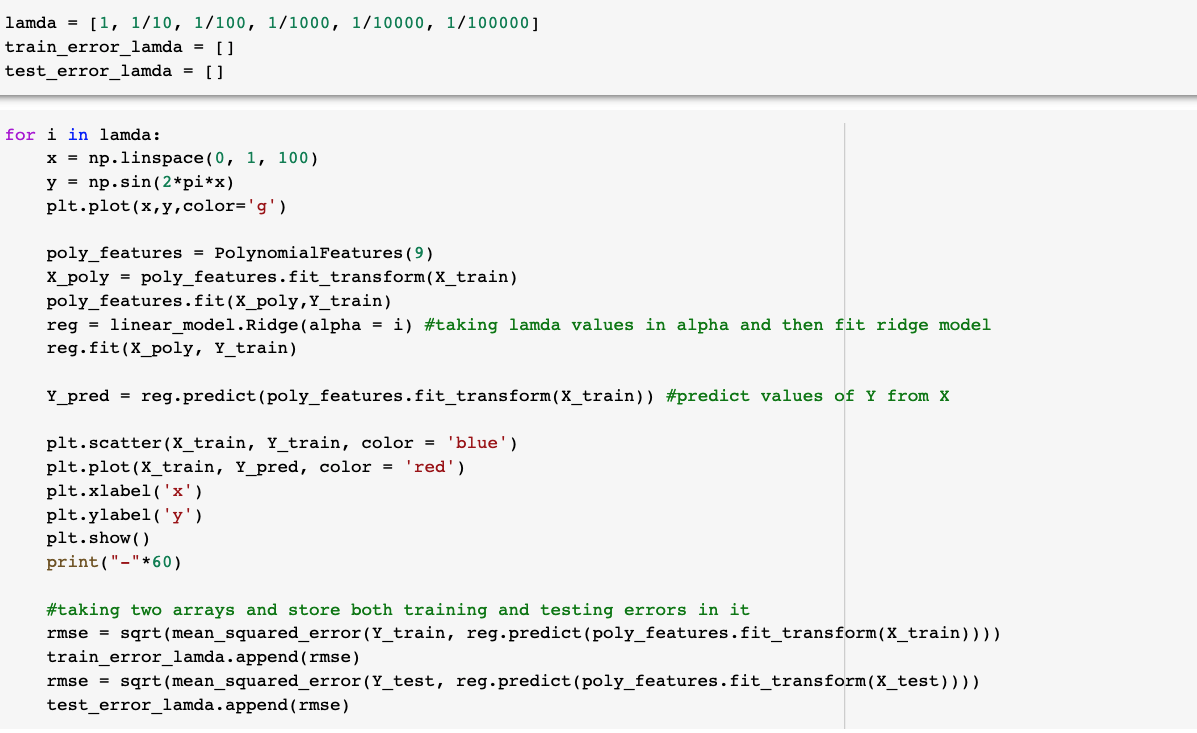
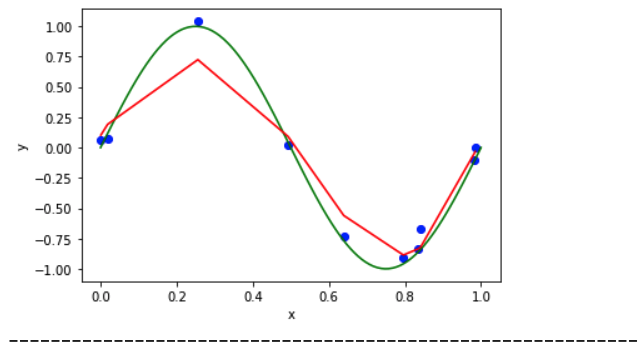
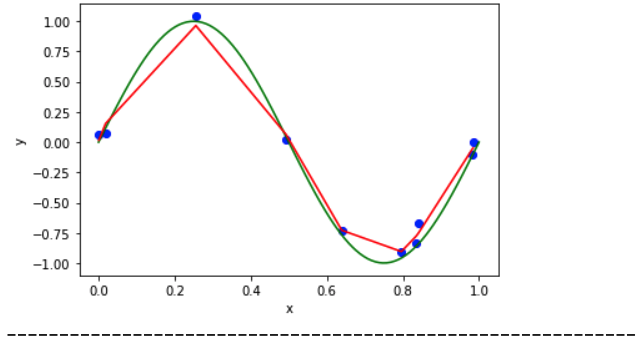
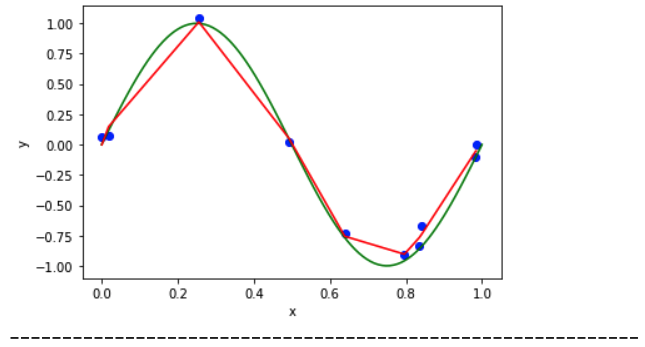
The Lambda graphs:
When Lambda = 1 :
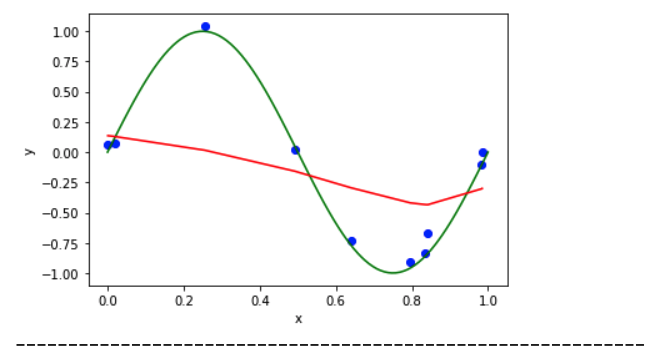
When Lambda = 1/10 :
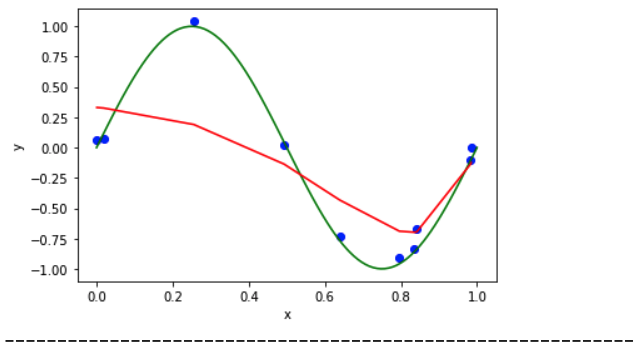
When Lambda = 1/100 :
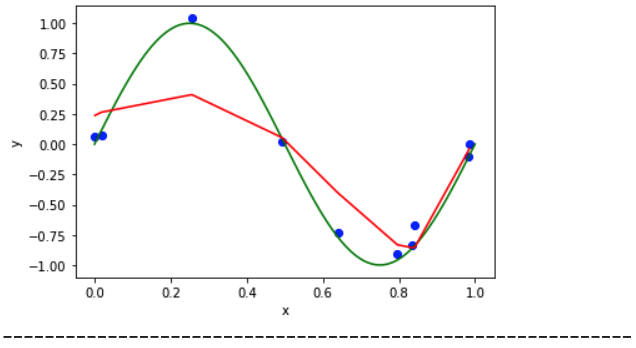
When Lambda = 1/1000 :
When Lambda = 1/10000 :
When Lambda = 1/100000 :
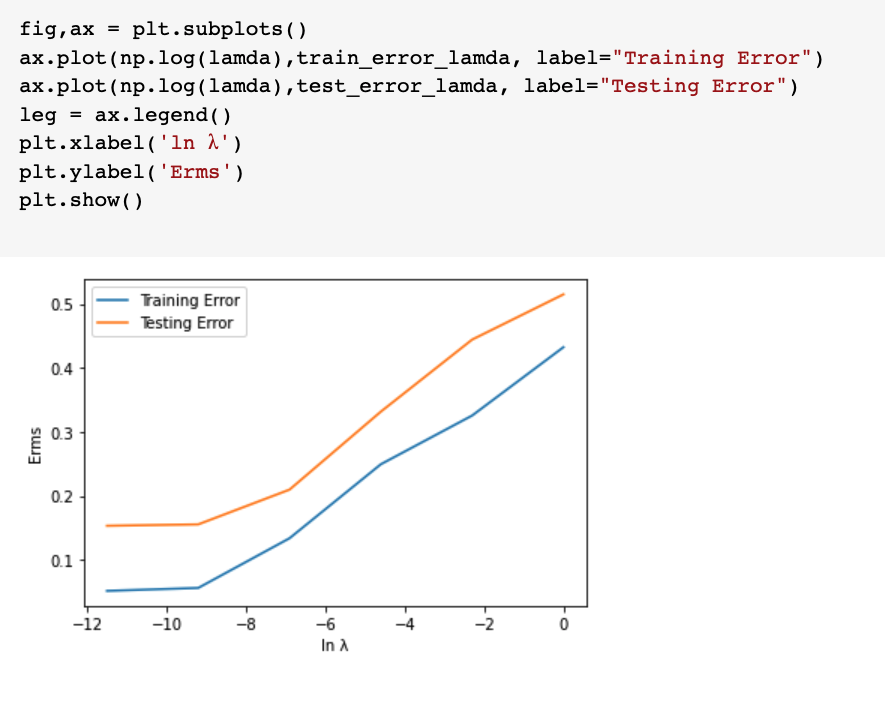
The Training and Test error of the Lambda Values are:
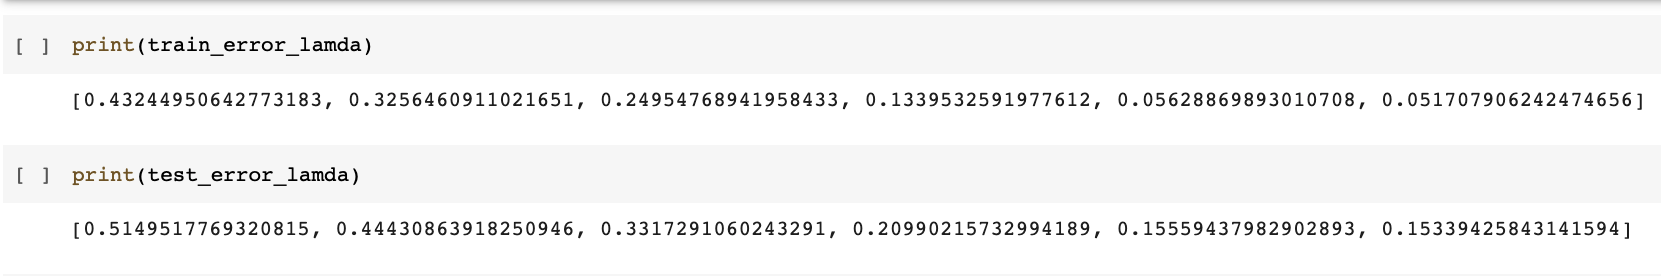
Now according to the Lambda values, draw the Training and Test Values
Challenges and contributions:
There are large datasets as some of the independent data are correlated with other data. First I tried using LASSO which uses L1 regularization( does the feature selection automatically) but the result was not accurate as LASSO cannot be used as it can only be used if we have correlated variables and it turns one variable to zero and retains only one variable. This was resulting in low accuracy for the model and loss of Information.
So, I used Ridge Regression as it reduces model complexity and it shrinks the parameters. It shrinks the parameters which result in reducing the variance For the optimization function to be penalized, lambda regularizes the coefficients in a way that they(coefficients) take huge values. This was the more optimal method and we can prevent Overfitting using Ridge Regression.
References:
- https://laptrinhx.com/what-is-overfitting-in-machine-learning-and-how-to-avoid-it-1333335641/
- https://www.datasciencecentral.com/profiles/blogs/deep-dive-into-polynomial-regression-and-overfitting
- https://towardsdatascience.com/linear-regression-using-python-b136c91bf0a2
- https://towardsdatascience.com/polynomial-regression-bbe8b9d97491
- https://scikit-learn.org/stable/auto_examples/model_selection/plot_underfitting_overfitting.html
- https://statisticsbyjim.com/regression/overfitting-regression-models/
- https://machinelearningmastery.com/overfitting-and-underfitting-with-machine-learning-algorithms/
- https://www.datacamp.com/community/tutorials/towards-preventing-overfitting-regularization
- https://elitedatascience.com/overfitting-in-machine-learning
- https://blogs.sas.com/content/subconsciousmusings/2017/07/06/how-to-use-regularization-to-prevent-model-overfitting/
- https://www.analyticsvidhya.com/blog/2015/02/avoid-over-fitting-regularization/
- https://analyticsindiamag.com/types-of-regularization-techniques-to-avoid-overfitting-in-learning-models/